


The ASX 200 extended its rebound for a fourth straight session on Thursday, but the move lacked conviction. Gains were marginal, breadth was balanced and sector leadership was narrow — a sharp contrast to the stronger rally shaping up on Wall Street. With Australian rate expectations firming and several rate-sensitive sectors under pressure, the local market remains vulnerable despite the short-term bounce.
View related analysis:
- USD/JPY, Nikkei Outlook: Japanese Yen Weakens amid Risk-On Tone
- Nasdaq 100 Outlook: Thanksgiving Seasonality and Volatility Trends
- ASX 200 Market Outlook: FMG Eyes Breakout, WOW Firms Up
- Nasdaq 100 Leads Wall Street, Meta Bounce Gains Traction
- ASX 200 Market Outlook: Industrials Lead Rebound, Brambles BXB Perks Up
Financials Lead Bearish Signals as NAB Weakens
ASX 200 Market Snapshot
- The Australian share market rose for a fourth day on Thursday, tracking the positive sentiment on Wall Street heading into US Thanksgiving.
- However, its 0.1% gain came with a narrow 0.55% trading range, signalling a general lack of enthusiasm from bulls.
- Breadth was balanced, with 94 ASX 200 stocks advancing and 94 declining, while the remainder were unchanged.
- Still, nine of the eleven ASX sectors advanced, led by Technology (XIJ), Health Care (XHJ) and Consumer Discretionary (XDJ), while Energy (XEJ) and Materials (XMJ) edged lower.
- The ASX is now close to erasing all of last week’s gains to snap a four-week losing streak — though that doesn't necessarily mean the broader market has escaped the negative sentiment that drove it to a six-month low.
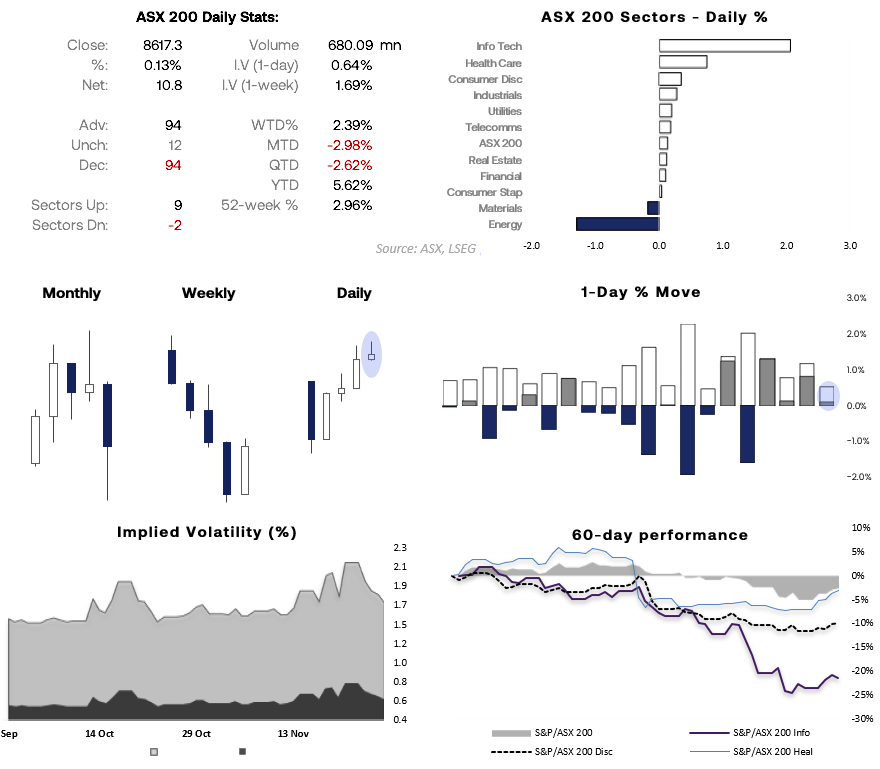
Chart analysis by Matt Simpson - source: ASX, LSEG

ASX 200 Sector Analysis
While the ASX has just enjoyed its first four-day rally since May, it’s hardly setting the world alight — particularly when two of those supposedly bullish sessions were effectively flat, and Wall Street has delivered stronger gains over the same period.
The RBA is no longer expected to cut rates, and cash-rate futures are now beginning to price in a possible hike in the second half of next year. If economic data continues to firm and supports those expectations, the Real Estate (XRE) index could face renewed selling pressure.
The same applies to the Technology (XIJ) sector, which has only managed a modest bounce from recent lows, as well as Consumer Discretionary (XDJ). Traders should also keep a close eye on the Financials (XFJ) index, which appears to be forming a bearish flag on the daily chart.
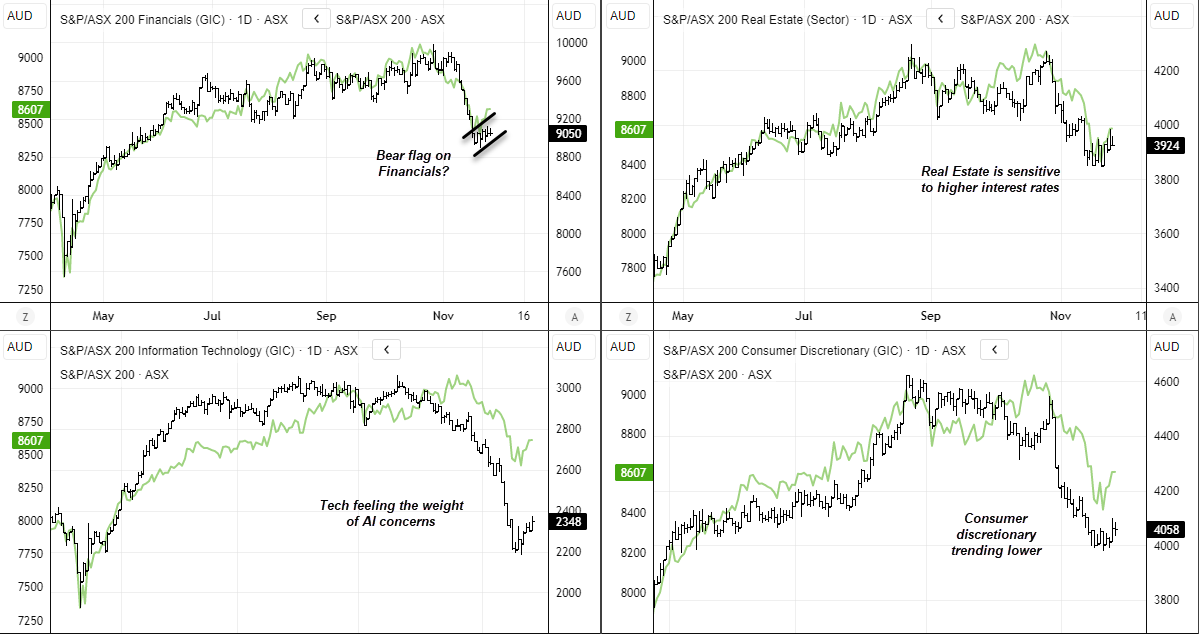
Chart analysis by Matt Simpson - source: ASX, LSEG

National Australia Bank (NAB) Technical Analysis
Of Australia’s ‘big four’ banks, NAB is standing out as a potential short. The market topped on 6 November with an elongated bearish engulfing candle, and a clear downtrend has since developed on the daily chart. Prices are trading within what appears to be a bear flag, projecting a target just above 38 — aligning with the 200-day SMA and the August VPOC.
The daily RSI (14) is drifting lower, not oversold, and with no bullish divergence in sight. A bearish engulfing candle also formed on higher volume on Wednesday within the flag, sitting around the 10-day SMA.

Chart analysis by Matt Simpson - Source: TradingView, ASX SPI 200 Index Futures
View the full economic calendar
-- Written by Matt Simpson
Follow Matt on Twitter @cLeverEdge
How to trade with City Index
You can trade with City Index by following these four easy steps:
- Open an account, or log in if you’re already a customer
• Open an account in the UK
• Open an account in Australia
• Open an account in Singapore
- Search for the market you want to trade in our award-winning platform
- Choose your position and size, and your stop and limit levels
- Place the trade


